
This post appeared originally in our sysadvent series and has been moved here following the discontinuation of the sysadvent microsite
Performance tuning is done to increase system performance, reduce power usage or to ease the application impact on the rest of the system. If done prematurely, or without any measurements, performance tuning may, of course, have the opposite effect.
But done systematically, performance tuning can be more of a science than an art form.
The method
Start by figuring out what the “normal” situation is.
Look for potential performance issues, and adjust tuning parameters to fix them. Look for changes in how the system behaves, and decide to either keep the changes, or roll back.
To summarise:
- Start collecting data to establish a baseline
- Enable tuned, and select a sensible default
- Look at graphs, did we make the right choice? Commit or rollback.
- Identify a potential performance issue
- Adjust tuning parameters
- GOTO 3
Before we start, establish a baseline
Before-and-after metrics
For specific metrics, you can quickly establish a baseline for an application by using a “stress tester” before and after your change. Look at the Stress testing with Apache JMeter article from earlier in the sysadvent calendar for an example.
Historical metrics
If you have it available, use historical resource monitoring, with
graphs. Even in this day of automation, and analysis, The old
Mk1 Eyeball is still surprisingly useful, and for that,
you need graphs, and not a wall of numbers.
(Also, you can show the pretty graphs to your boss in case they drop in and ask what you are spending precious company time on.)
You should graph the usage and response time on the service provided. For a web server, this would be number of requests, response time per request, and also size per response.
For Apache and Nginx, see the Logging elapse time in Apache and Nginx post describing how to log the necessary numbers.
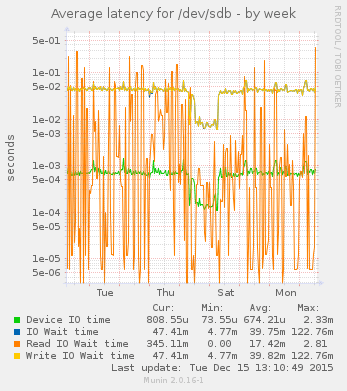
You should graph the usage, queue and response time on the resources it uses. This often means resource graphs for disk and network IO. Graph the number of requests per second, as well as the request-response latency.
Tools for graphing
I am partial to using Munin, which is available in the EPEL repository. It is definitely “old-school”, but it is easy to start using, and has an amazing range of available plugins. Munin should give you a lot of graphs by default when you install it, and more plugins to graph things are available in the contrib repository.
For more modern monitoring, Elasticsearch, Logstash and Kibana (ELK) are popular for for log analysis and visualisation. To push data into your ELK setup, use Topbeat for resource usage metrics, Filebeat for real time log file analysis, and Packetbeat for analysing your network data on the wire.
Alternatives are many. Use what you know, like, or want to learn. The most important thing is: Ensure you know your baseline before you start changing things.
Tools for performance tuning
tuna
Tuna allows you to control processor and scheduling affinity.
For example: If you have poor network performance on an otherwise beefy system, and see that several cores are idle, check that your network card have enabled multiple scheduling queues, and that they are spread over all available cores.
Example for network cards named “enp1s0f0” and “enp1s0f1”:
$ tuna --irq 'enp1s0f*' --socket 0 --spread --show_irqs
   # users            affinity
  69 enp1s0f0                0  igb
  70 enp1s0f0-rx-0           1  igb
  71 enp1s0f0-rx-1           2  igb
  72 enp1s0f0-rx-2           3  igb
  73 enp1s0f0-rx-3           4  igb
  74 enp1s0f0-tx-0           5  igb
  75 enp1s0f0-tx-1           6  igb
  76 enp1s0f0-tx-2           7  igb
  77 enp1s0f0-tx-3           0  igb
  79 enp1s0f1                1  igb
  80 enp1s0f1-rx-0           2  igb
  81 enp1s0f1-rx-1           3  igb
  82 enp1s0f1-rx-2           4  igb
  83 enp1s0f1-rx-3           5  igb
  84 enp1s0f1-tx-0           6  igb
  85 enp1s0f1-tx-1           7  igb
  86 enp1s0f1-tx-2           0  igb
  87 enp1s0f1-tx-3           1  igb
With multiple sockets, you can move your favourite processes to one socket, and the network handling to another.
tuned
Tuned has been available in Red Hat for several releases.
Tuned comes with a variety of tuning profiles; sensible defaults for various common server roles. There is one for “virtualisation guests”, one for “virtualisation hosts”, as well as “high throughput” or “low latency” profiles. They should provide starting points for further exploration.
Example:
$ tuned-adm list
- balanced
- desktop
- latency-performance
- network-latency
- network-throughput
- powersave
- throughput-performance
- virtual-guest
- virtual-host
Current active profile: throughput-performance
The different default profiles are well documented, and are a good starting point for customising your own, if desired.
The default profile on physical machines is “throughput-performance” or “balanced”, and the default profile on virtual machines is “virtual-guest”.
The default profiles in tuned are in /usr/lib/tuned.
$ tree /usr/lib/tuned
/usr/lib/tuned
|-- balanced
|   `-- tuned.conf
|-- desktop
|   `-- tuned.conf
|-- functions
|-- latency-performance
|   `-- tuned.conf
|-- network-latency
|   `-- tuned.conf
|-- network-throughput
|   `-- tuned.conf
|-- powersave
|   |-- script.sh
|   `-- tuned.conf
|-- recommend.conf
|-- throughput-performance
|   `-- tuned.conf
|-- virtual-guest
|   `-- tuned.conf
`-- virtual-host
    `-- tuned.conf
They contain a tuned.conf file with INI file semantics,
and an optional shell script.
To make your own, copy one of the directories to /etc/tuned/, make adjustments, and activate.
cp -a /usr/lib/tuned/throughput-performance /etc/tuned/wonderprofile
vim /etc/tuned/wonderprofile/tuned.conf
tuned-adm profile wonderprofile
Example /etc/tuned/wonderprofile/tuned.conf, include a
profile, and make minor adjustments:
[main]
include=throughput-performance

[sysctl]
net.ipv4.tcp_rmem="4096 87380 16777216"
net.ipv4.tcp_wmem="4096 16384 16777216"
net.ipv4.udp_mem="3145728 4194304 16777216"
Example /etc/tuned/wonderprofile/script.sh:
#!/bin/sh
#Lots of functions in here to use
. /usr/lib/tuned/functions

start() {
    [ "$USB_AUTOSUSPEND" = 1 ] && enable_usb_autosuspend
    enable_wifi_powersave
    return 0
}

stop() {
    [ "$USB_AUTOSUSPEND" = 1 ] && disable_usb_autosuspend
    disable_wifi_powersave
    return 0
}

process $@
Further reading
I’ve just mentioned a small number of tools available for the system administrator. Red Hat has extensive documentation, showing what to tune and how to measure (or the other way around), using many more tools than the ones I’ve mentioned.
For power management, getting your laptop through the workday even when you forgot your charger at home, see Red Hat Enterprise Linux 7 Power Management Guide
For performance tuning, getting more oomph out of your very expensive servers, see Red Hat Enterprise Linux 7 Performance Tuning Guide
Measure with a micrometer Mark with a chalk Cut with an axe
Update
- 2025-09-03: Format

EL9's grubby sorting
So I had this el9 machine that had been sitting quietly waiting for updates for a bit too long. Blinded by courage, I went in and did a
dnf update, rebooted, and lo and behold, it worked without a hitch afterwards. Except just one small one: It did not automatically boot the newest kernel. I tried the standard things. Look at /etc/default/grub, look at the output of various grubby commands. To no avail. It simply would ... [continue reading]