
This post appeared originally in our sysadvent series and has been moved here following the discontinuation of the sysadvent microsite
This is the first of three posts about Elastic Stack.
Introduction
At a glance, Elastic Stack is a web based search engine. It’s like Google. For your logs.
Elastic stack contains multiple components.
- Elasticsearch stores your data, and eats all your disk space.
- Kibana, the web interface. It looks nice, sends queries to Elasticsearch, and presents the results in a readable way.
- Logstash, reads logs, receives logs from remote systems, runs the logs through filters to make structured data, and store them in Elasticsearch.
- Filebeat, a lightweight agent which read log files, attach metadata, and can send them to Logstash.
Installation Methods
“That sounds good”, you may think, “How do I set it up?”. There are a few ways we can do this, and the choice is yours.
Installing with Docker
You can try it out using docker on your laptop. I’m not going to cover it here.
Installing with OS Packages
You can set it up on a Linux server using YUM and APT packages provided by Elastic on their packaging repository.
In this post, I will use the OS packages for installation.
Installing with Configuration Management Systems
You can automate setup and maintenance of a cluster of servers using configuration management software. For that, I can point you in the direction of their respective module repositories.
Puppet
Officially supported Puppet modules are Elasticsearch/elasticsearch and Elasticsearch/Logstash
There are more modules contributed by the community. Search the Puppet Forge for Elasticsearch, Logstash, Kibana or Filebeat.
Ansible
The officially supported role from Elastic is for Elasticsearch.
There are more roles contributed by the community. Search the Ansible Galaxy for Elasticsearch, Logstash, Kibana or Filebeat.
Security
I recommend you ensure the Elasticsearch API ports are not reachable from untrusted sources, and that access to Kibana is restricted, and that your searches and logs are kept confidential. Ensure your firewall is up
A Shodan search for Elasticsearch shows that many, many people have not secured their installation. Please do so, so you don’t expose your logs and data.
Firewall
Ensure your Elastic Stack is not reachable from the Internet.
By default, Kibana and Elasticsearch listens on localhost only. If you change this, ensure that your Kibana and Elasticsearch instances are not reachable by the general public.
Encrypted connection
The Elasticsearch search API is based on HTTP. If you are accessing your Elastic Stack installation over a network, you should encrypt your connections.
A front end web server, for instance “Nginx”, can be used for this. Let “Nginx” listen on port 80 (unencrypted HTTP), and redirect traffic to 443 (encrypted HTTPS).
For HTTPS certificates, we can use Let’s encrypt to make and keep certificates up to date. “acmetool” is simple to use.
Password protection
Add username / password protection for access to Elasticsearch. You can use the front end web server
Role based access control
You can subscribe to a license for the X-Pack plugin from Elastic. This has role-based access control, and many other features. I’m not going to cover this.
Installing Elastic Stack
Boot a CentOS7 minimal VM
I downloaded “CentOS-7-x86_64-Minimal-1511.iso” from one of the CentOS download sites, and installed it to a new virtual machine.
SSH to it
Log on to the new machine, and become root.
Install prerequisites
Install EPEL repository
If you install with “Puppet” or “Ansible”, you will need the EPEL repository.
$ yum install epel-release
...

Installed:
  epel-release.noarch 0:7-6

Complete!
Install java
Elasticsearch needs Java 8 or later, so you will need to install a JVM. In EPEL, we have OpenJDK 8 available:
$ yum -y install java-1.8.0-openjdk-headless
...

Installed:
  java-1.8.0-openjdk-headless.x86_64 1:1.8.0.111-1.b15.el7_2

Dependency Installed:
...

Complete!
Install elastic stack
With the prerequisites installed, we are ready for the Elastic Stack.
Note: For more detailed instructions for each step, see https://www.elastic.co/guide/en/elastic-stack/current/index.html
Install package repository
To install the Elastic package repository, we install their GPG key, and add a yum configuration file for their repository.
$ rpm --import https://artifacts.elastic.co/GPG-KEY-elasticsearch
$ cat > /etc/yum.repos.d/elastic.repo
[elasticsearch-5.x]
name=Elasticsearch repository for 5.x packages
baseurl=https://artifacts.elastic.co/packages/5.x/yum
gpgcheck=1
gpgkey=https://artifacts.elastic.co/GPG-KEY-elasticsearch
enabled=1
autorefresh=1
type=rpm-md
…and hit “Control-D”. “yum” should now be ready.
Install Elasticsearch
$ yum install elasticsearch
...

Installed:
  elasticsearch.noarch 0:5.0.1-1

Complete!
Start and enable the Elasticsearch service
Services are not started by default on Red Hat OS family.
Start the service, and check its status. If it starts, all is well, and you can enable the service, which will ensure it starts after the next reboot.
$ systemctl start elasticsearch.service
$ systemctl status elasticsearch.service
● elasticsearch.service - Elasticsearch
   Loaded: loaded (/usr/lib/systemd/system/elasticsearch.service; disabled; vendor preset: disabled)
   Active: active (running) since Fri 2016-11-25 06:55:39 EST; 979ms ago
     Docs: http://www.elastic.co
  Process: 10934 ExecStartPre=/usr/share/elasticsearch/bin/elasticsearch-systemd-pre-exec (code=exited, status=0/SUCCESS)
 Main PID: 10936 (java)
   CGroup: /system.slice/elasticsearch.service
           └─10936 /bin/java -Xms2g -Xmx2g -XX:+UseConcMarkSweepGC -XX:CMSInitiatingOccupancyFraction=75 -XX:+UseCMSInitiatingOccupan...

Nov 25 06:55:39 elastic.local systemd[1]: Starting Elasticsearch...
Nov 25 06:55:39 elastic.local systemd[1]: Started Elasticsearch.
$ systemctl enable elasticsearch.service
Created symlink from /etc/systemd/system/multi-user.target.wants/elasticsearch.service to /usr/lib/systemd/system/elasticsearch.service.
Check that Elasticsearch is running
The Elasticsearch listens for HTTP requests on port 9200 by default. You can check that your Elasticsearch instance is up by running:
curl http://localhost:9200
The expected output should be something like:
{
  "name" : "ZVasElj",
  "cluster_name" : "elasticsearch",
  "cluster_uuid" : "NRmDw4b2QvuCQYlnrRyeSQ",
  "version" : {
    "number" : "5.0.1",
    "build_hash" : "080bb47",
    "build_date" : "2016-11-11T22:08:49.812Z",
    "build_snapshot" : false,
    "lucene_version" : "6.2.1"
  },
  "tagline" : "You Know, for Search"
}
To check its health, you can query the API for the health of the cluster:
curl http://localhost:9200/_cluster/health?pretty
The expected output should be something like:
{
  "cluster_name" : "elasticsearch",
  "status" : "green",
  "timed_out" : false,
  "number_of_nodes" : 1,
  "number_of_data_nodes" : 1,
  "active_primary_shards" : 0,
  "active_shards" : 0,
  "relocating_shards" : 0,
  "initializing_shards" : 0,
  "unassigned_shards" : 0,
  "delayed_unassigned_shards" : 0,
  "number_of_pending_tasks" : 0,
  "number_of_in_flight_fetch" : 0,
  "task_max_waiting_in_queue_millis" : 0,
  "active_shards_percent_as_number" : 100.0
}
One node, zero documents. Looks about right for a fresh install.
Install Kibana
When Elasticsearch is up and running, we can install Kibana, which is the search web application.
$ yum install kibana
[...]

Installed:
  kibana.x86_64 0:5.0.1-1

Complete!
Start and enable the Kibana service
Install and enable the Kibana service. This is the web interface we use for searching logs.
$ systemctl status kibana
● kibana.service - Kibana
   Loaded: loaded (/etc/systemd/system/kibana.service; disabled; vendor preset: disabled)
   Active: inactive (dead)
$ systemctl start kibana
$ systemctl status kibana
● kibana.service - Kibana
   Loaded: loaded (/etc/systemd/system/kibana.service; disabled; vendor preset: disabled)
   Active: active (running) since Fri 2016-11-25 07:06:03 EST; 829ms ago
 Main PID: 11722 (node)
   CGroup: /system.slice/kibana.service
           └─11722 /usr/share/kibana/bin/../node/bin/node --no-warnings /usr/share/kibana/bin/../src/cli -c /et...

Nov 25 07:06:03 elastic.local systemd[1]: Started Kibana.
Nov 25 07:06:03 elastic.local systemd[1]: Starting Kibana...
$ systemctl enable kibana
Created symlink from /etc/systemd/system/multi-user.target.wants/kibana.service to /etc/systemd/system/kibana.service.
Check that Kibana is ready to serve
Kibana listens on port 5601, and serves web pages. We can check that
it is operational by using the http or curl commands.
$ http http://localhost:5601
HTTP/1.1 200 OK
Connection: keep-alive
Date: Wed, 30 Nov 2016 14:14:31 GMT
Transfer-Encoding: chunked
cache-control: no-cache
content-encoding: gzip
content-type: text/html; charset=utf-8
kbn-name: kibana
kbn-version: 5.0.1
vary: accept-encoding

<script>var hashRoute = '/app/kibana';
var defaultRoute = '/app/kibana';

var hash = window.location.hash;
if (hash.length) {
  window.location = hashRoute + hash;
} else {
  window.location = defaultRoute;
}</script>
Install and enable the firewall daemon
There are multiple ways to maintain the Linux firewall rule set. The firewall daemon “firewalld” included in multiple distributions works rather well.
$ yum install firewalld
...

Installed:
  firewalld.noarch 0:0.3.9-14.el7

Dependency Installed:
...
Complete!
Start and enable the firewall daemon
$ systemctl status firewalld
● firewalld.service - firewalld - dynamic firewall daemon
   Loaded: loaded (/usr/lib/systemd/system/firewalld.service; enabled; vendor preset: enabled)
   Active: inactive (dead)
$ systemctl start firewalld
$ systemctl status firewalld
● firewalld.service - firewalld - dynamic firewall daemon
   Loaded: loaded (/usr/lib/systemd/system/firewalld.service; enabled; vendor preset: enabled)
   Active: active (running) since Fri 2016-11-25 07:03:21 EST; 1s ago
 Main PID: 11325 (firewalld)
   CGroup: /system.slice/firewalld.service
           └─11325 /usr/bin/python -Es /usr/sbin/firewalld --nofork --nopid

Nov 25 07:03:21 elastic.local systemd[1]: Starting firewalld - dynamic firewall daemon...
Nov 25 07:03:21 elastic.local systemd[1]: Started firewalld - dynamic firewall daemon.
$ systemctl enable firewalld
Add a host name
I’ve used “elastic.local” for my elastic stack node. If you have a local VM, add it to /etc/hosts along with its IP addresses.
2001:db8::1 elastic.local
192.0.2.1   elastic.local
If you have installed to an external server, you should select a host name within your domain, and add it to DNS.
Test with a browser
At this point, you can point your browser to http://elastic.local:5601 if you have installed Elasticsearch to your local desktop machine.
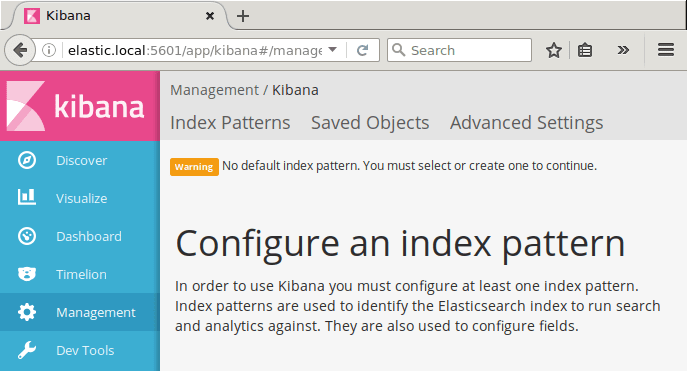
Note the warning at the bottom of the page:

This is because we have not added any data yet. In an upcoming post, I will write about Logstash and Filebeat.

Just-Make-toolbox
make is a utility for automating builds. You specify the source and the build file and make will determine which file(s) have to be re-built. Using this functionality in make as an all-round tool for command running as well, is considered common practice. Yes, you could write Shell scripts for this instead and they would be probably equally good. But using make has its own charm (and gets you karma points).
Even this ... [continue reading]