
This post appeared originally in our sysadvent series and has been moved here following the discontinuation of the sysadvent microsite
Thruk comes natively with Naemon, and is a free and open source full drop in replacement web interface for Nagios, Icinga and Shinken. These are flexible tools for alerting us when something goes horribly wrong, and Thruk adds a few tricks for even better monitoring.
With this blog entry I will highlight some of Thruk’s nicer features, and show how easy it is to get get up and running in a couple of steps.
Introduction
Thruk is written using the Plack framework, running as a fastcgi process with authentication handled by Apache. It requires the Livestatus API running on your monitoring server. Using Livestatus Thruk can run independent of your monitoring server, so you can install it on a remote host.
If you want to try it out before installing it, a demo is provided here
Features
Thruk has many great features, but the first thing you notice is the speed.Even a configuration with thousands of hosts and tens of thousands of serviceshas sub second response times for service listings and search results. But the killer feature of Thruk is arguably it’s multi back end support. Sayyou have a old legacy Nagios installation still in production in addition to anew Naemon or Icinga 2 server. With Thruk you can configure both of these asbackends for Thruk, and it will give you one unified view to all hosts andservices configured. One less tab in your browser.
Thruk also has a few additionsto the classic web interfaces that makes it a bitmore user friendly and expands monitoring and reporting functionality, here is a non-exhaustive list.
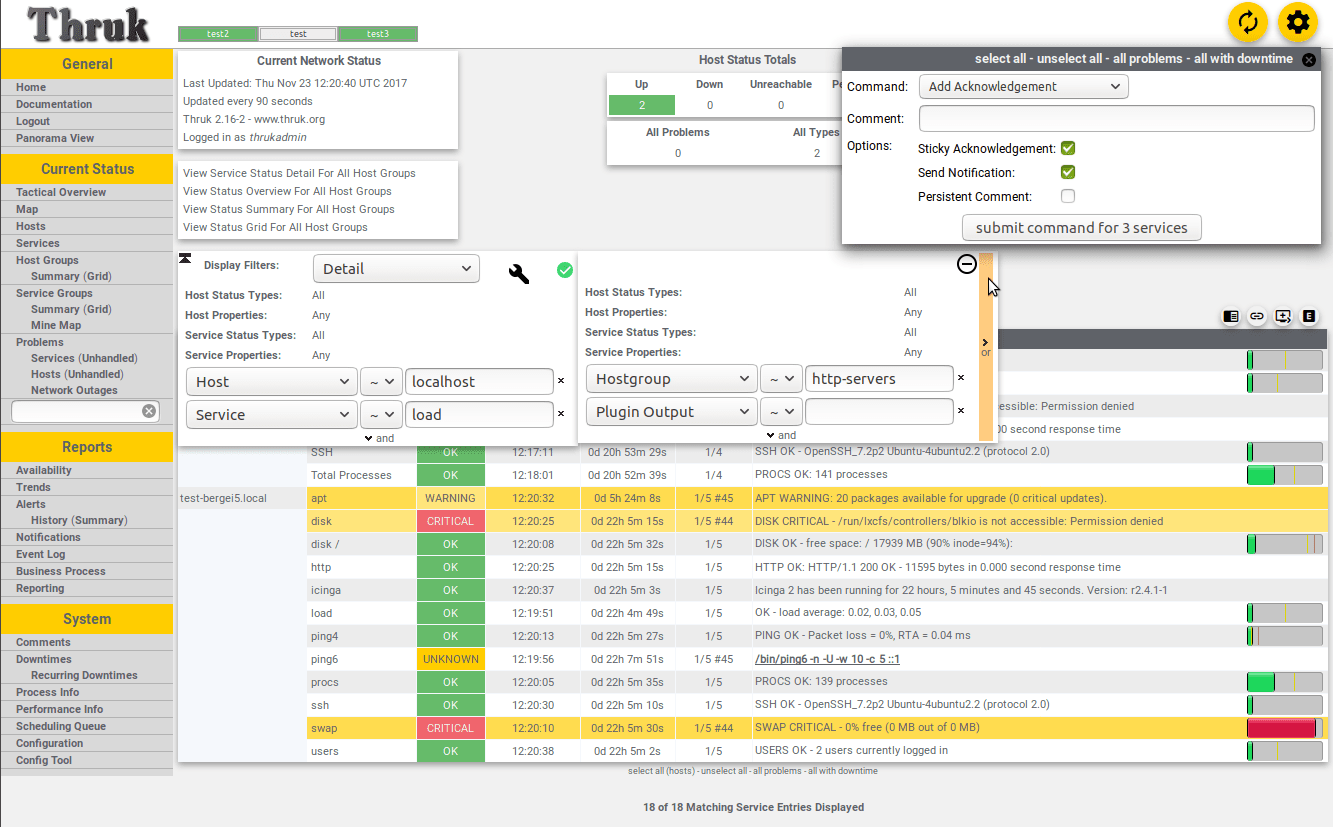
Display Filter and sending multiple commands
Combine multiple filters with simple AND OR operators and regular expressions,to create a display with just the hosts and services you want. From there it’s easy to send multiple commands to all services, for example a reschedule or downtime command.
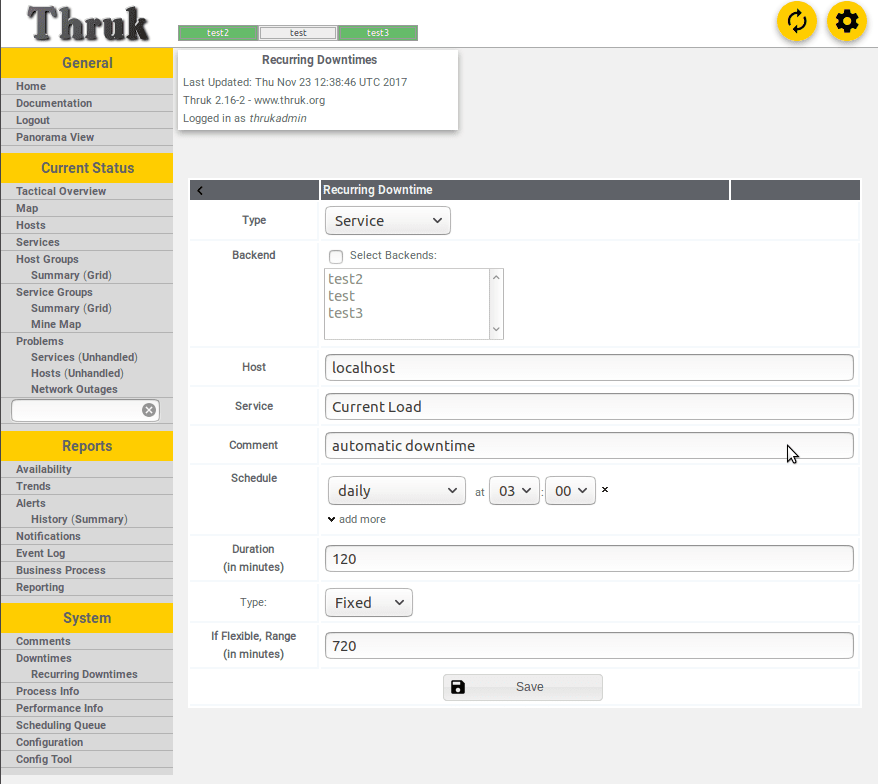
Recurring Downtime
Schedule downtime for services with periodic downtime, Thruk will issue the downtime command to the monitoring core as an external command, so notifications for that service will be disabled for the time period.
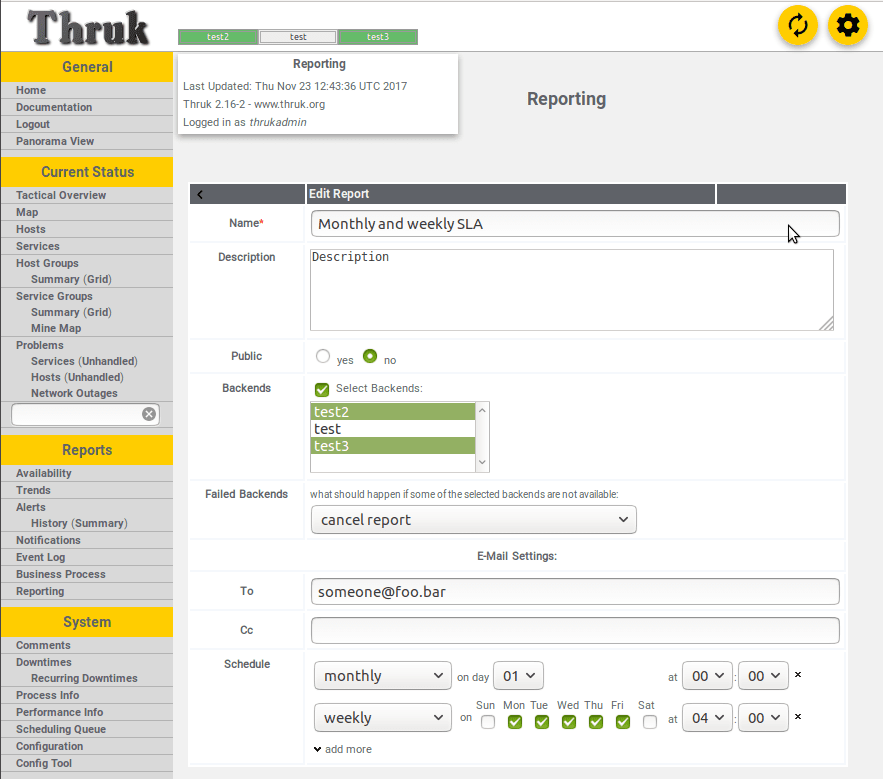
Periodic SLA Reports
Schedule daily, weekly or monthly SLA reports in PDF format to email recipients.
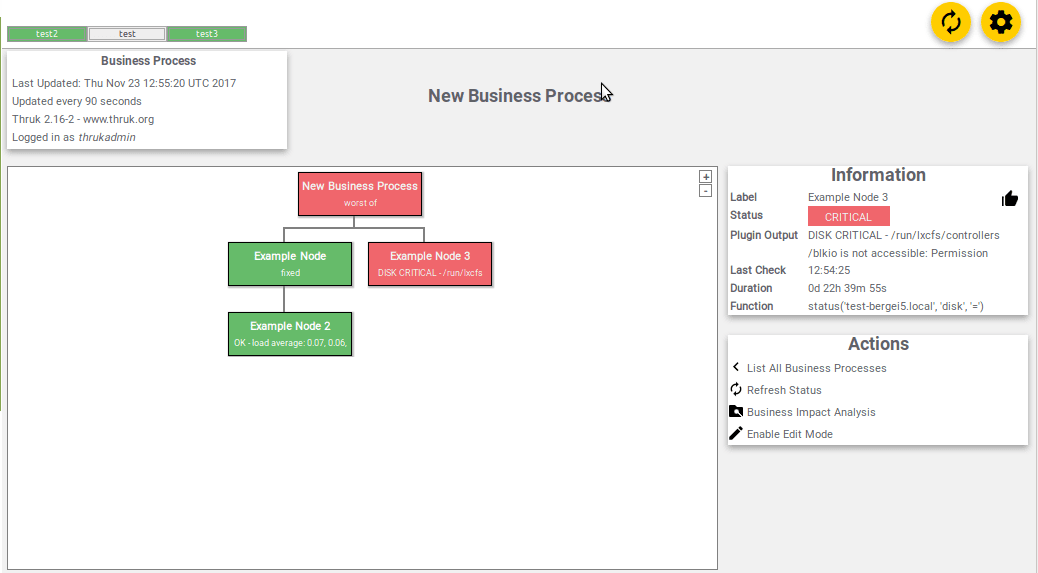
Business process views
Structure together your hosts and services to view their association for yourapplication or business processes. The business process will be created as astandard host object, so you can run standard notifications on it. For example it’s easy here to include all servers in a cluster into a business process, andthen get a single notification if available servers is under a certainthreshold.
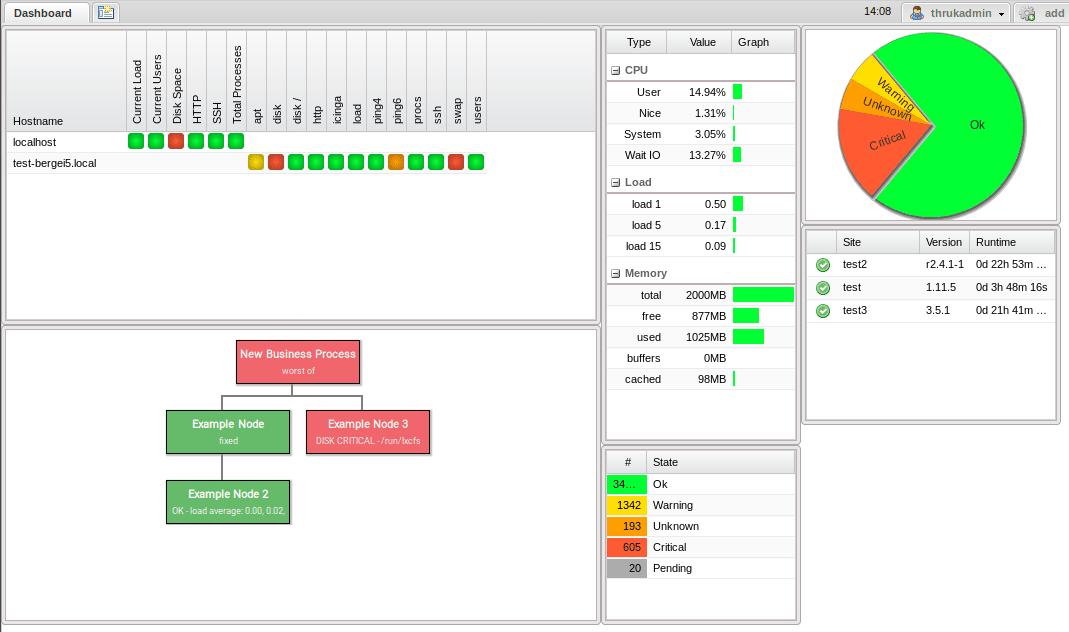
Dashboard
Create custom dashboard for big screens. Create the good old geomap, or ascreen filtered with just your mission critical services, latest monitoring alerts and a pie chart or two.
Installation
Let’s install Thruk on the monitoring server, and add a connection to the Livestatus socket. I will provide some examples along the way for Debian systems.
Thruk provides packages for Debian, CentOS, Fedora, SLES and Ubuntu. Using the Console Labs Repository is the easiest way to install Thruk - https://labs.consol.de/repo/
Add your repositories and install Thruk, then point your browser to http://yourhostname/thruk The default login is thrukadmin with password thrukadmin
Livestatus
To integrate it with your monitoring daemon we need a working livestatus setup. Shinken comes with Livestatus enabled by default, so it should work out of the box. A re-implementation of the Livestatus protocol comes bundled with Icinga 2,so you just need to enable it
icinga2 feature enable livestatus
icinga2 feature enable compatlog
usermod -a -G nagios www-data
systemctl restart icinga2
On a Debian system you now can find your livestatus socket here: /var/run/icinga2/cmd/livestatus
On Debian/Ubuntu systems you can install the provided “check-mk-livestatus”package. If you need RPM packages you can find it the Console Labs Repository.
Here is an example for Debian systems:
apt-get install check-mk-livestatus
add the broker module to naemon.cfg, nagios.cfg or icinga.cfg:
broker_module=/usr/lib/check_mk/livestatus.o /tmp/live.sock
Then restart the monitoring daemon, and you will find your socket under/tmp/live.sock
Thruk Configuration
Let’s add a Livestatus connection for Icinga 2 in /etc/thruk/thruk_local.confand restart Thruk.
<Component Thruk::Backend>
    <peer>
        name    = Icinga2        id      = 7215e
        type    = livestatus
        <options>
            peer          = /var/run/icinga2/cmd/livestatus
        </options>
    </peer>
</Component>
or if you installed Livestatus manually by the example, point peer to/tmp/live.sock
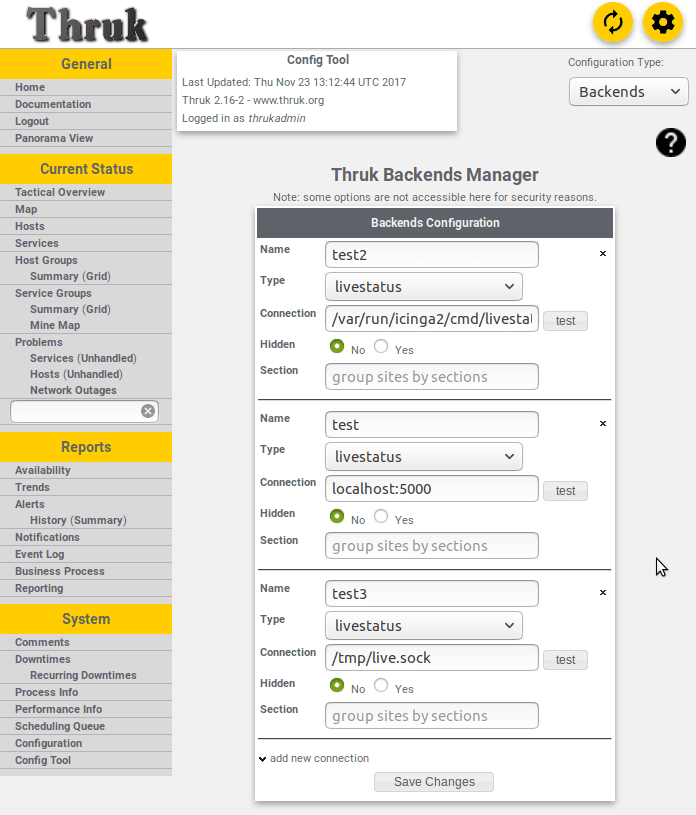
You can also add a connection from the fronted with the config tool.
That’s it, keep on Thruking!
Just-Make-toolbox
make is a utility for automating builds. You specify the source and the build file and make will determine which file(s) have to be re-built. Using this functionality in make as an all-round tool for command running as well, is considered common practice. Yes, you could write Shell scripts for this instead and they would be probably equally good. But using make has its own charm (and gets you karma points).
Even this ... [continue reading]