
This post appeared originally in our sysadvent series and has been moved here following the discontinuation of the sysadvent microsite
This is the last of three posts about Elastic Stack.
By now, we should have a reasonably secure Elastic Stack. It is sadly empty, so we should feed it some logs.
Logstash is a log processor. It can be configured with inputs, filters, and outputs.
- Inputs are commonly log files, or logs received over the network.
- Filters are used to accept, drop and modify log events.
- Outputs are used for storing the filtered logs.
Filebeat is a log shipper. It reads logs, and sends them to Logstash.
In this example, we’ll send log files with Filebeat to Logstash,
configure some filters to parse them, and output parsed logs to
Elasticsearch so we can view them in Kibana.
Install Logstash
-
Install Logstash.
yum -y install logstash -
Start Logstash.
 $ systemctl status logstash.service
 ● logstash.service - logstash
    Loaded: loaded (/etc/systemd/system/logstash.service; disabled; vendor preset: disabled)
    Active: inactive (dead)
 $ systemctl start logstash.service
 $ systemctl enable logstash.service
 Created symlink from /etc/systemd/system/multi-user.target.wants/logstash.service to /etc/systemd/system/logstash.service.
 $ systemctl status logstash.service
 ● logstash.service - logstash
    Loaded: loaded (/etc/systemd/system/logstash.service; enabled; vendor preset: disabled)
    Active: active (running) since Tue 2016-11-29 08:55:02 EST; 6s ago
  Main PID: 1793 (java)
    CGroup: /system.slice/logstash.service
            └─1793 /usr/bin/java -XX:+UseParNewGC -XX:+UseConcMarkSweepGC -XX:CMSInitiatingOccupancyFraction=75 -XX:+UseCMSInitiatingO...

 Nov 29 08:55:02 elastic.local systemd[1]: Started logstash.
 Nov 29 08:55:02 elastic.local systemd[1]: Starting logstash...
Configure Logstash
Testing the Logstash configuration can be done with:
/usr/share/logstash/bin/logstash -t --path.settings /etc/logstash/
Logstash will log to /var/log/logstash/logstash-plain.log by
default. If are running logstash as root to test the
configuration, you will need to ensure that the logstash user has
write access to that log file.
Entropy starvation
Now, here’s a funny thing…
Logstash runs in a ruby interpreter inside the Java Virtual Machine. On some systems, CentOS 7 included, java libraries will read from the system entropy pool. On a virtual machine there will not be a large amount of random bytes available, so that can block startup of Logstash until there is enough random bytes available.
If Logstash is slow to start, where “slow” is “several minutes with no
apparent activity or useful log messages”, you may benefit from
installing an entropy gathering daemon like haveged.
yum install haveged
systemctl start haveged
systemctl enable haveged
Configuring Logstash
We need to configure an input, an output, and a filter for our audit log. You can split the configuration into multiple files, if you like. They are read in alphabetical order.
The input accepts logs from Filebeat. The output sends logs to
Elasticsearch. The filters we need to write ourselves, or just
cut-n-paste from the Internet.
The audit log arrives as a text line. It is a bit tricky to parse, requiring two passes through the “kv” filter. If you like, you can read more about it the format of the audit log in the Red Hat Security Guide
# /etc/logstash/conf.d/10-input.conf
input {
  beats {
    port => 5044
  }
}

# /etc/logstash/conf.d/10-output.conf
output {
  elasticsearch { }
}

# /etc/logstash/conf.d/50-filter.audit.conf
filter {
  if [source] == "/var/log/audit/audit.log" {
    kv {
      target => "audit"
    }
    kv {
      source => "[audit][msg]"
      target => "[audit][_msg]"
    }
    grok {
      match        => { "[audit][msg]" => "audit\(%{NUMBER:_timestamp}:%{NUMBER:_id}\):" }
      remove_field => [ "[audit][msg]" ]
    }
    mutate {
      rename => {
        "_id"           => "[audit][event_id]"
        "[audit][_msg]" => "[audit][msg]"
      }
      split => {
        "[audit][msg][grantors]" => ","
      }
    }
    date {
      match        => [ "_timestamp", "UNIX" ]
      remove_field => [ "_timestamp" ]
    }
  }
}
To parse more logs, look at the Logstash documentation.
Filebeat
Filebeat is the log shipper running on a client host. In this case, we install it on the same host as the rest of the software stack, allowing access to our own logs.
Installing Filebeat
yum -y install filebeat
Configuring Filebeat
Initially, we will let Filebeat follow the audit log.
---
filebeat.prospectors:
- input_type: log
  paths:
    - "/var/log/audit/audit.log"
output.logstash:
  hosts:
  - "localhost:5044"
Start Filebeat
systemctl start filebeat
systemctl enable filebeat
When you start Filebeat it will read the log file, and connect to
Logstash. Logstash should log entries to its log file with reassuring
messages like creating index and update_mapping as soon as it
receives data.
Configure Kibana
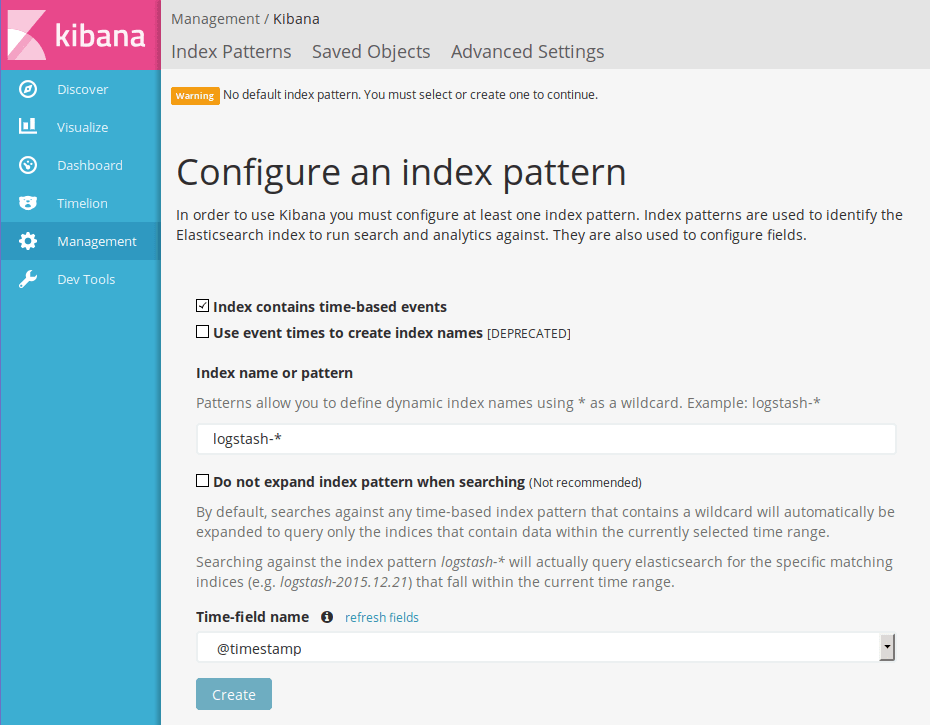
Go to the Kibana web interface. Since Logstash now has created some
data, Kibana should be able to start. You should be redirected to a
page titled “Configure an index pattern”. Just accept the defaults,
and hit the Create button.
With the configured audit log parser, we should have data for searching.
Example Searches
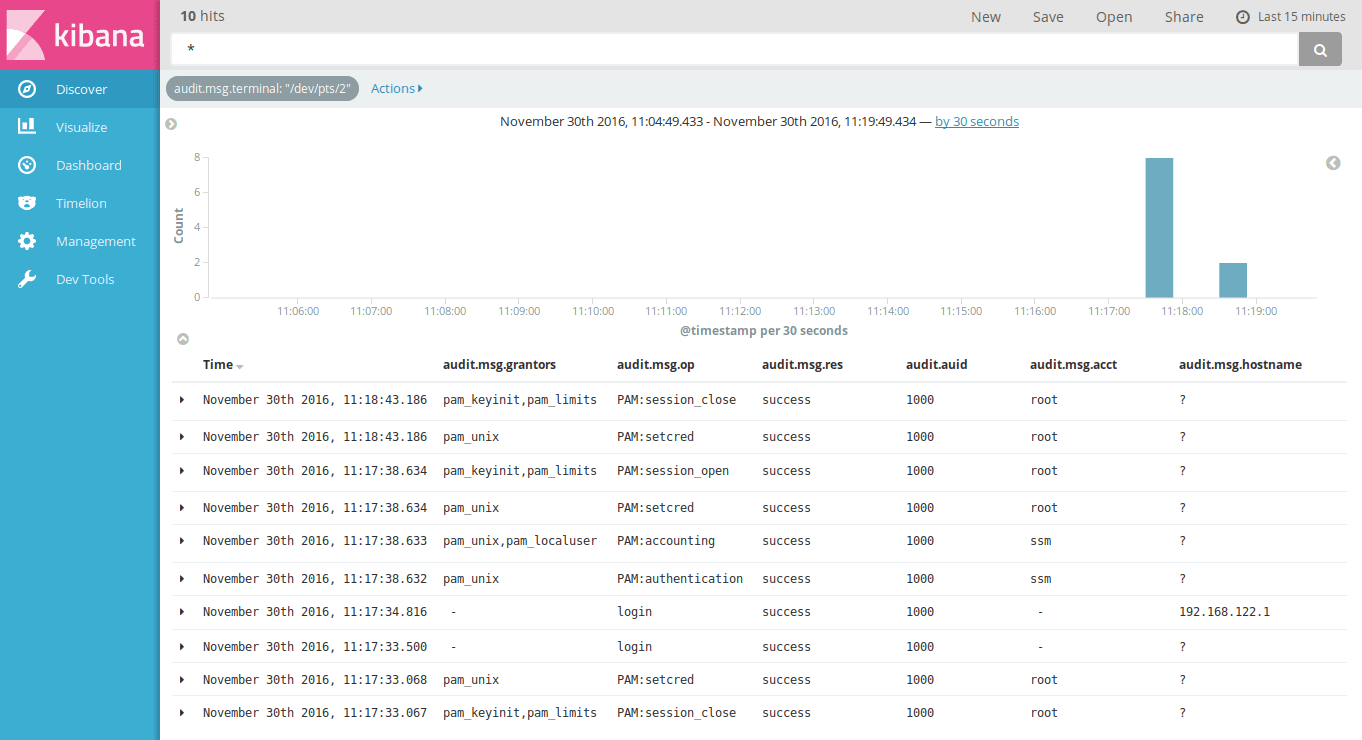
Here, we have limited log activity to audit logs with the
audit.msg.terminal value set to /dev/pts/2, this shows a login
session:
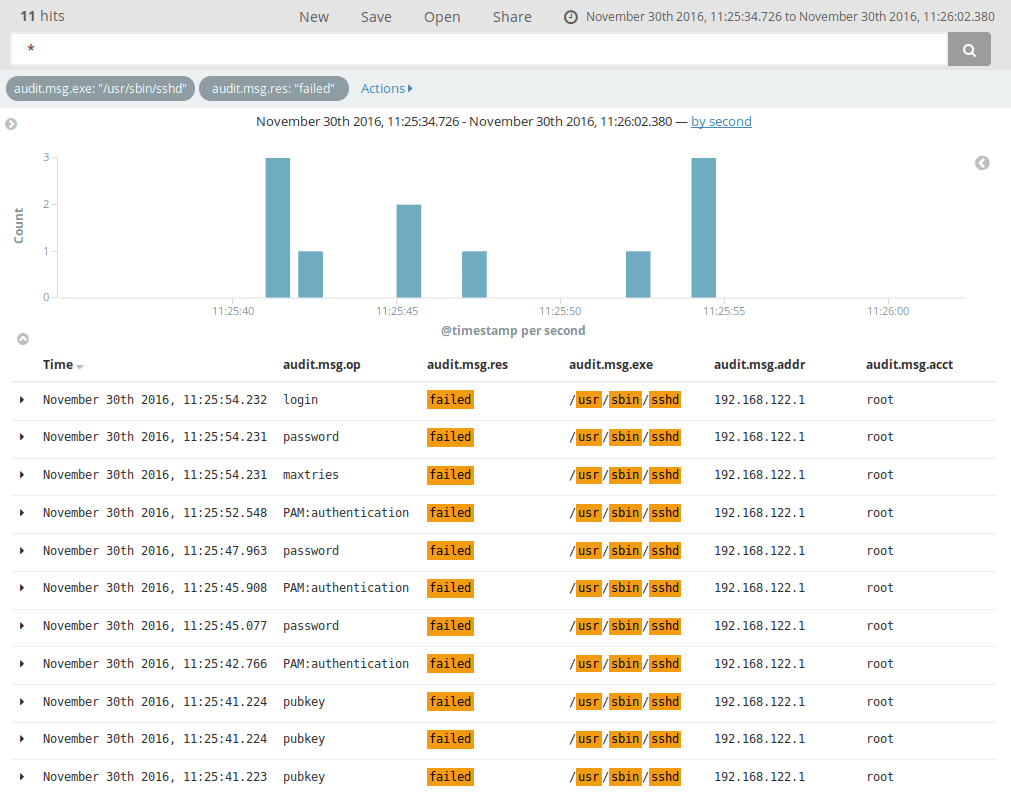
Here, we have limited log activity to audit logs with the
audit.msg.exe value set to /usr/bin/sshd, and where any operation
result (audit.msg.res) is failed. With the current logs, this
shows failed root logins, and a nice detail with the types of
authentication methods which failed:
Finally
We now have parsed logs and configure up a searchable interface.
Kibana can do much more than just search. If you hit Visualize, you
can create graphs and tables.
If you hit Dashboard, you can collect searches, graphs and tables on
a single page to make dashboards.
The basic workflow is:
- Look for interesting data, and save that search.
- Make graphs, lists and tables based on that search, and save those visualizations.
- Collect the search log table, the graphs and other visualizations, and save that dashboard.
- Display the dashboard on a wall screen at your office.
Have fun!

From a Luddite to a Vibe-Coder
For those who are unfamiliar with the word “luddite”, it was an organized movement of unemployed textile workers being against progress and sabotaging equipment like the power loom in the post banner. We don’t do sabotage, but we’re also not unemployed … yet! On the other hand, many of us seem to be struck by the Ostrich effect.
The modern luddite attitude to AI
It proved difficult to find an image of an ostrich with the head ... [continue reading]