Power BI continues to be one of the most popular Business Intelligence solutions, gaining advantage by allowing teams to meet the needs of business users, data scientists and data science professionals and meet business needs in terms of business intelligence and reporting functions. However, analytical capabilities of Power Bi can be boosted through integration with R. Complementing Power BI with customized and statistical analysis, machine learning, and data visualization. Integration of Power BI and R brings benefits at every stage of generating insights from data, so let’s cover it.
Adding Statistics Insights
Using R scripts as a data source users can run code directly in Power BI and import the resulting data sets into a Power BI data model, that allows to leverage everything that R can do, including all data science and machine learning capabilities to achieve different goals and understand high-level data behavior like building forecasting and trends, classification, finding groups and clusters or anomalies detection. By using R script, rather than a pre-build Power BI solutions, you can get more levels of control over the outcomes, or you might want to see a certain level of efficiency or speed that one approach provides. One of the good practices is to develop and test any machine-learning script in R IDE directly for more control and validation.
Data Enrichment with R
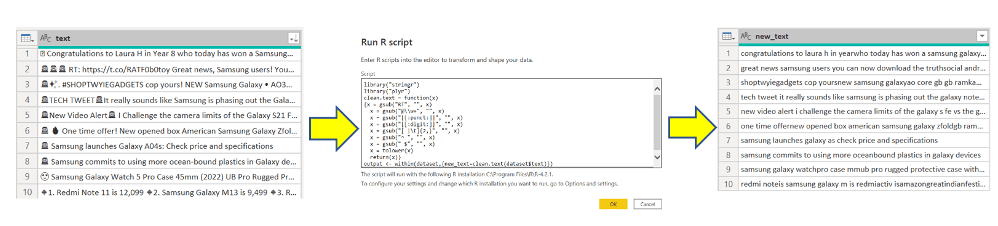
R can be also leveraged during data transformation stage in Power Query, where advanced cleaning and processing steps can be easily obtained rather than using native M language of Power Query. language, are much easier to be performed with R. It is possible to apply advanced data cleaning and preparations steps like missing values completion or data normalization. An example of an application of R for data cleaning purpose is to leverage gsub() function to work with regular expressions to replace all the matches of a pattern from a string. It allows to quickly and easily a get rid or replace the string objects such as unnecessary spaces, tabs, numbers, punctuation marks etc. Output of this transformation can be used for further text analytics.
Data Visualization
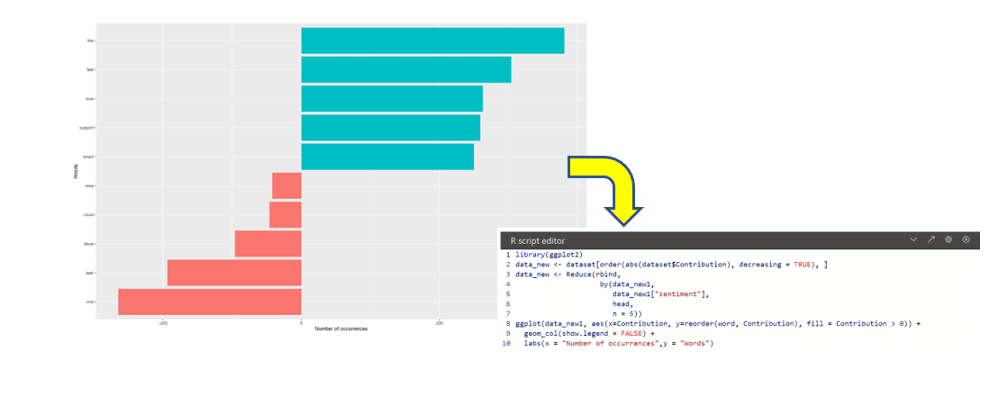
The last option, the most common and best-known, is to use R in Power BI while create custom charts that exceed Power BI out-of-the-box products. Even though Power BI offers a wide range of built-in visualizations, some type of data or business use cases might require specific tuning and tailoring options to meet requirements and display insights correctly.
R visuals allow you to present data by gaining endless flexibility and advanced analytics depth, additionally data transformation for specific chart purpose can be done without changing the data source but reshaping, grouping or deconstructing data differently to get format for specific aesthetics. The best way to do it is via ggplot2 package that offers not only a plethora of chart options for the visual, but also a quite extensive array of formatting options. Charts are built layer by layer by adding new elements so that dashboard can be enhanced with 3D graphs, animations that spin around or show transition between several distinct stages of the data.
Key advantages of consuming the results of R visuals in Power BI is that is provides reproduceablity as everything is code-driven. There’s no pointing and clicking, and that makes things more customisable and reduce number of steps when processing. The downsides, on the other hand, is that they’re not interactive. The image is just static. We can’t interact by clicking or hovering over for tool-tips or cross filtering the dashboard. However, R visuals react to refresh on data as well as filtering or highlighting.
I hope you enjoy above brief walk-through of possible ways to use R language to extend the base functionality of Power BI. It is worth remembering if Power BI is lacking a certain visual needed for a project, building the visual manually in R is always a fun experience with a good payoff. The general methods of running scripts as a data source, via Power Query and inside of visuals can be done in Python scripts as well!