Used in the right way, this technology can create insight into large portions of data and help organizations in making the right decisions. Facebook, Google, LinkedIn and others are already using this technology to help advertisers target the right audience with the right messaging.
This has sparked an interest also from the traditional industries on how they can make use of this powerful technology. For example, in the car industry, companies may gather information about the vehicle and easily extract necessary information i.e. for analytics about the customers, the most sold vehicle, etc.
When the interest for the technology broadens and moves into new organizations, one challenge is the user ability to adopt and make use of the technology.
Another important use of Knowledge Graphs is “Data integration”, with Knowledge Graphs it is easy to integrate data from different sources and combine it, creating a Knowledge Graph(s). Data integration is the process of combining data from different sources and provide the user with a unified view of data.
A large fraction of data in the enterprise resides in the relational databases. One approach to data integration relies on a global schema that captures the interrelationships between the data items represented across these databases.
Creating a global schema is an extremely difficult process because there are many tables and attributes; the experts who created these databases are usually not available; and because of lack of documentation, it is difficult to understand the meaning of the data.
Because of the challenges in creating a global schema, it is convenient to sidestep this issue, and convert the relational data into a database with the generic schema of triples, i e a knowledge graph.
The mappings between the attributes are created on a needed basis, for example, in response to addressing specific business questions, and can themselves be represented within a knowledge graph
Before we enter into the topic of data integration using Knowledge Graph, I will mention a brief history of how data integration has been done through the years.
Data integration, the beginning
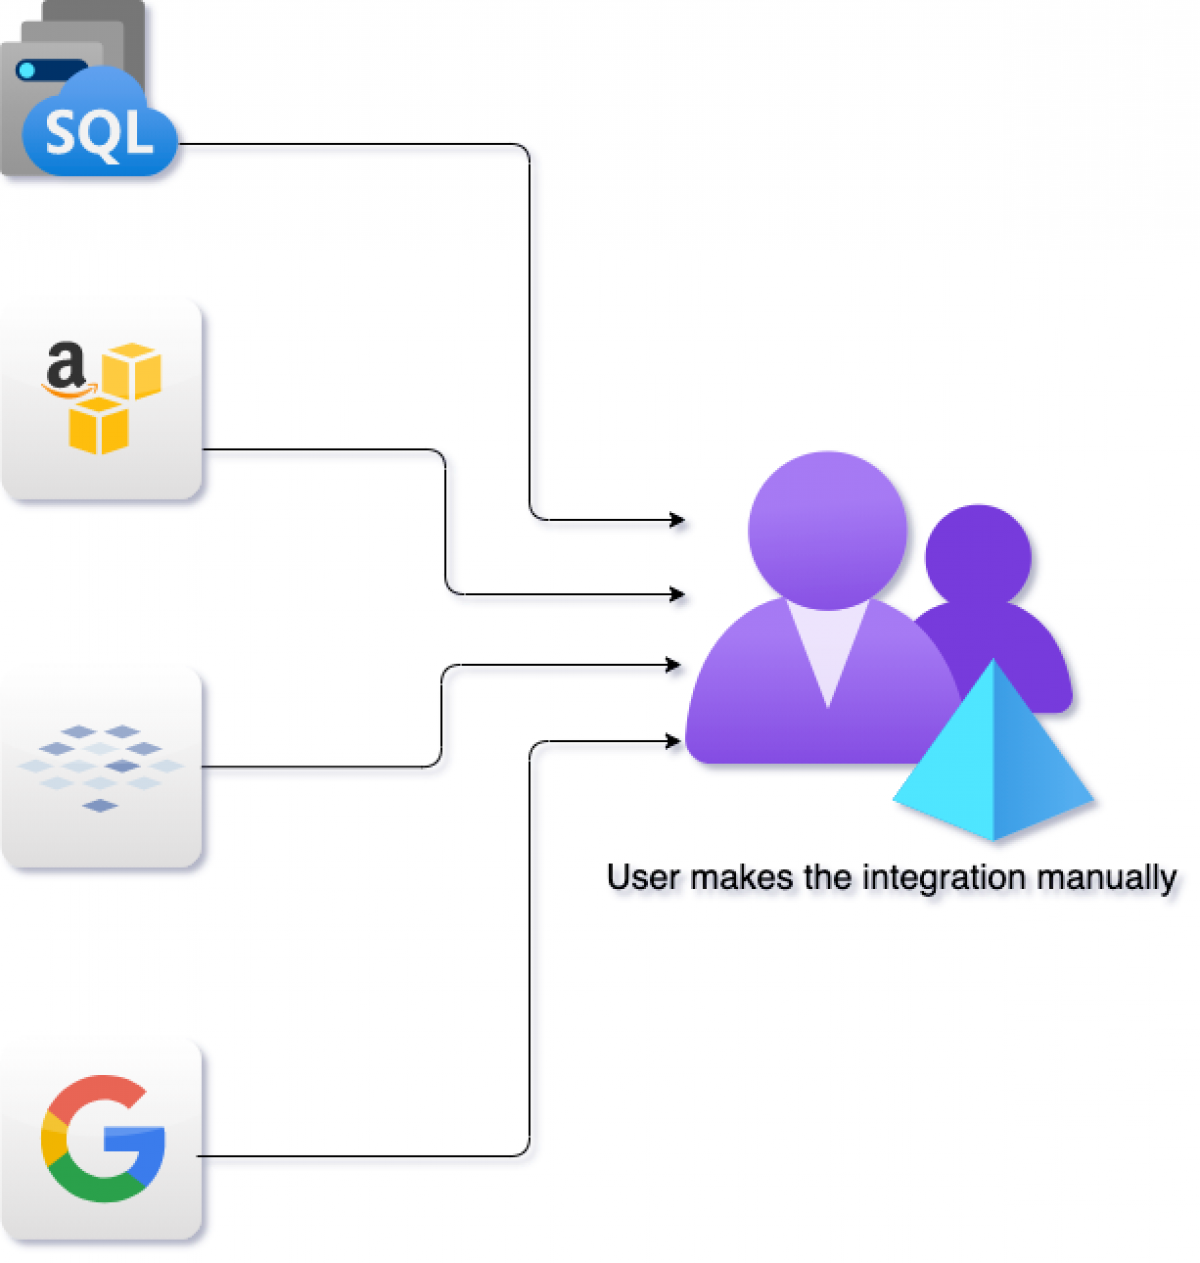
At the very beginning users needed to make their data integration manually, the user always accessed several system collecting data into a document, spread sheet, etc see figure 1 below.
What the user is doing putting the data in a format that makes sense, what I mean, the user is adding semantic(meaning) to the data, so we can conclude that the data + semantic = knowledge, and with this knowledge the user can make a well informed decision.
Data integration, second round, APIs
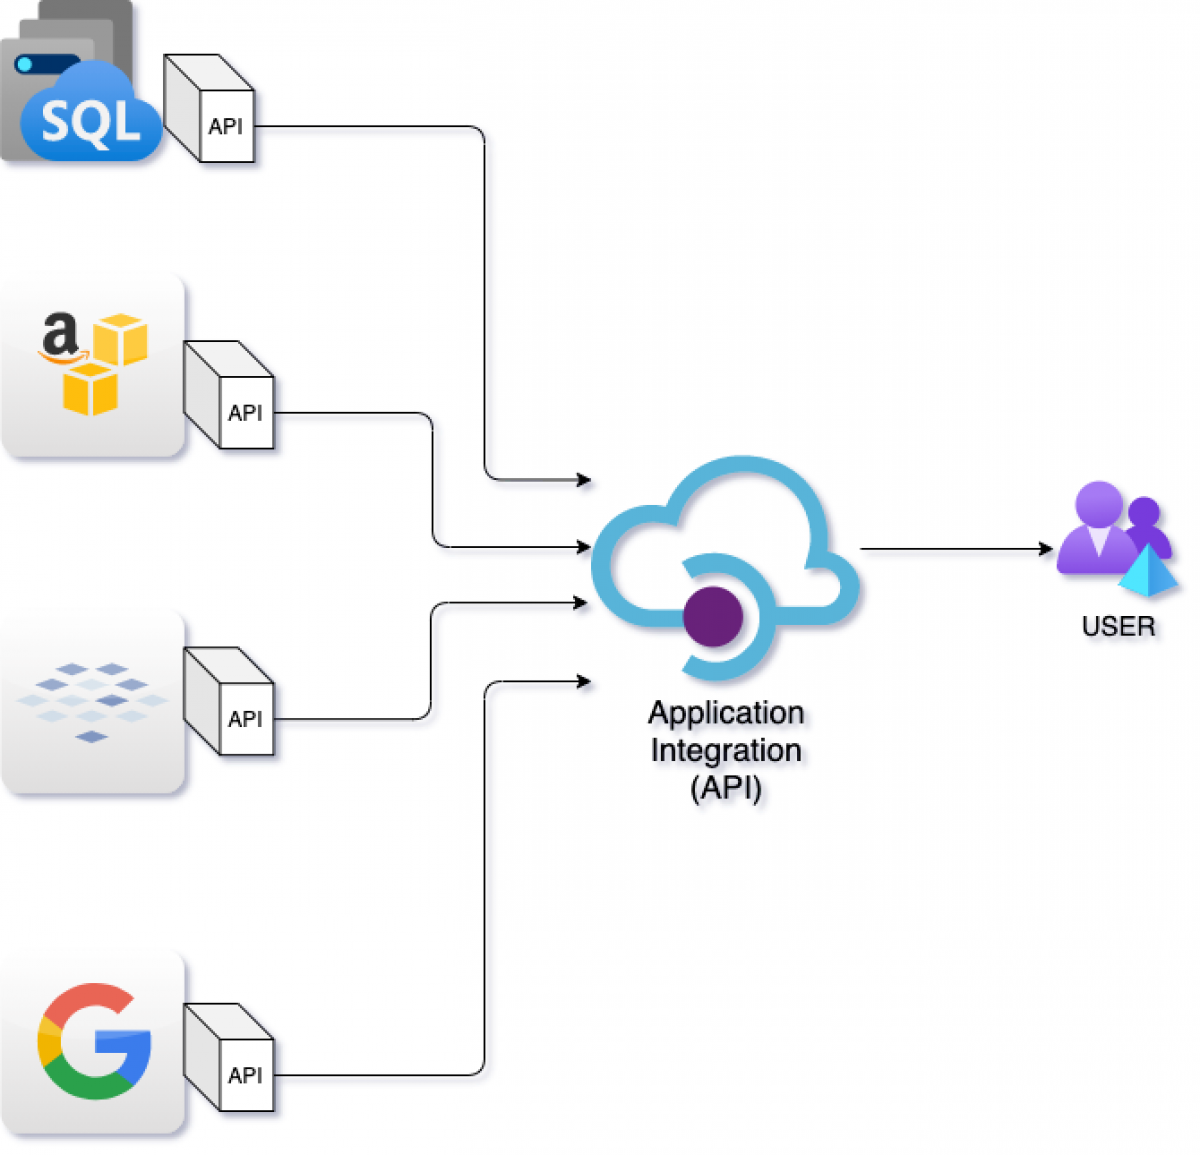
In the second round the concept of APIs came into the picture. The APIs have been the technology that has been driving data integration, using different architectures.
As I mention in the previous section “manual integration”, the use of APIs does the same adds semantic to the data turning it into knowledge. See figure 2 below:
Stay tuned for part 2
So what does the third round contain? Stay tuned for part 2 of this article, where I will share my thoughts on how Knowledge graphs can be used to integrate data and represent knowledge in an innovative way. I will also introduce you to the concept of “Ready to use Knowledge graphs".